My ESP crashes running some code. How to troubleshoot it?
- Introduction
- What ESP has to Say
- Get Your H/W Right
- What is the Cause of Restart?
- Exception
- Watchdog
- Exception Decoder
- Other Common Causes for Crashes
- If at the Wall, Enter an Issue Report
- Conclusion
Introduction
Your ESP is self restarting. You don’t know why and what to do about it.
Do not panic.
In most of cases ESP provides enough clues on serial monitor, that you can interpret to pin down the root cause. The first step is then checking what ESP is saying on serial monitor when it crashes.
What ESP has to Say
Start off by opening a Serial Monitor (Ctrl+Shift+M) to observe the output. Typical crash log looks as follows:
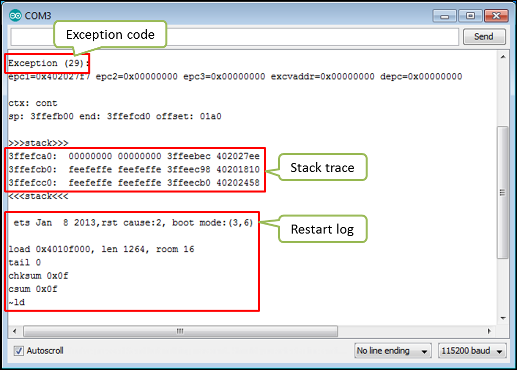
Typical crash log
Before rushing to copy and paste displayed code to Google, reflect for a while on the nature of observed restarts:
- Does ESP restart on random basis, or under certain conditions, like serving a web page?
- Do you see always the same exception code and stack trace or it changes?
- Does this issue occur with unmodified standard example code (Arduino IDE > File > Examples)?
If restarts are random or the exception code differs between restarts, then the problem may be caused by h/w. If the issue occurs for standard examples and stable esp8266 / arduino core, them the issue is almost certainly caused by h/w.
Get Your H/W Right
If you suspect the h/w, before troubleshooting the s/w, make sure to get your h/w right. There is no much sense in diagnosing the s/w if you board is randomly crashing because of not enough power, missing boot strapping resistors or loose connections.
If you are using generic ESP modules, please follow recommendations on power supply and boot strapping resistors.
For boards with integrated USB to serial converter and power supply, usually it is enough to connect it to an USB hub that provides standard 0.5A and is not shared with other USB devices.
In any case make sure that your module is able to stable run standard example sketches that establish Wi-Fi connection like e.g. HelloServer.ino.
What is the Cause of Restart?
You have verified that the ESP h/w is healthy but it still restarts. This is how ESP reacts to abnormal behavior of application. If something is wrong, it restarts itself to tell you about it.
There are two typical scenarios that trigger ESP restarts:
- Exception - when code is performing illegal operation, like trying to write to non-existent memory location.
- Watchdog - if code is locked up staying too long in a loop or processing some task, so vital processes like Wi-Fi communication are not able to run.
Please check below how to recognize exception and watchdog scenarios and what to do about it.
Exception
Typical restart because of exception looks like follows:
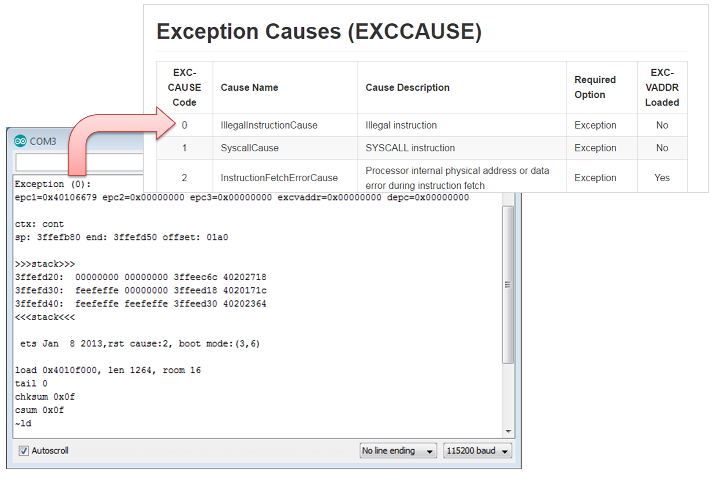
Exception cause decoding
Start with looking up exception code in the Exception Causes (EXCCAUSE) table to understand what kind of issue it is. If you have no clues what it’s about and where it happens, then use Arduino ESP8266/ESP32 Exception Stack Trace Decoder to find out in which line of application it is triggered. Please refer to Check Where the Code Crashes point below for a quick example how to do it.
Watchdog
ESP provides two watchdog timers (wdt) that observe application for lock up.
- Software Watchdog - provided by SDK, that is part of esp8266 / arduino core loaded to module together with your application.
- Hardware Watchdog - build in ESP8266 hardware and acting if software watchdog is disabled for too long, in case it fails, or if it is not provided at all.
Restart by particular type of watchdog is clearly identified by ESP on serial monitor.
An example of application crash triggered by software wdt is shown below.
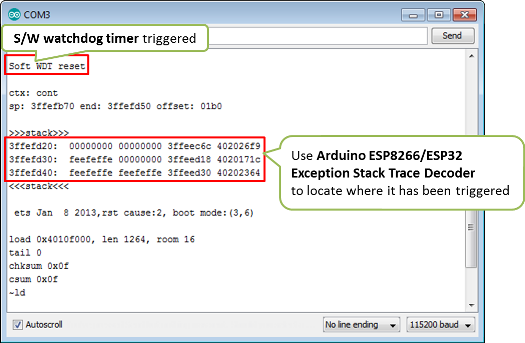
Example of restart by s/w watchdog
Restart by the software watchdog is generally easier to troubleshoot since log includes the stack trace. The trace can be then used to find particular line in code where wdt has been triggered.
Reset by hardware watchdog timer is shown on picture below.
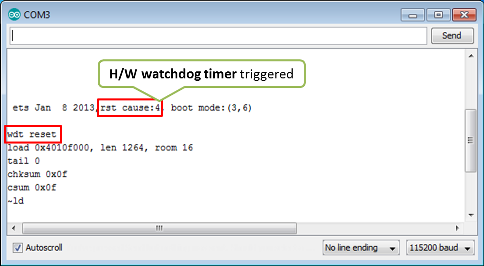
Example of restart by h/w watchdog
Hardware wdt is the last resort of ESP to tell you that application is locked up (if s/w wdt timer is disabled or not working).
Please note that for restarts initialized by h/w wdt, there is no stack
trace to help you identify the place in code where the lockup has
happened. In such case, to identify the place of lock up, you need to
rely on debug messages like Serial.print distributed across the
application. Then by observing what was the last debug message printed
out before restart, you should be able to narrow down part of code
firing the h/w wdt reset. If diagnosed application or library has debug
option then switch it on to aid this troubleshooting.
Exception Decoder
Decoding of ESP stack trace is now easy and available to everybody thanks to great Arduino ESP8266/ESP32 Exception Stack Trace Decoder developed by @me-no-dev.
Installation for Arduino IDE is quick and easy following the installation instructions.
If you don’t have any code for troubleshooting, use the example below:
void setup()
{
  Serial.begin(115200);
  Serial.println();
  Serial.println("Let's provoke the s/w wdt firing...");
  //
  // provoke an OOM, will be recorded as the last occured one
  char* out_of_memory_failure = (char*)malloc(1000000);
  //
  // wait for s/w wdt in infinite loop below
  while(true);
  //
  Serial.println("This line will not ever print out");
}

void loop(){}
Enable the Out-Of-Memory (OOM) debug option (in the Tools > Debug Level
menu), compile/flash/upload this code to your ESP (Ctrl+U) and start Serial
Monitor (Ctrl+Shift+M). You should shortly see ESP restarting every couple
of seconds and Soft WDT reset message together with stack trace showing
up on each restart. Click the Autoscroll check-box on Serial Monitor to
stop the messages scrolling up. Select and copy the stack trace, including
the last failed alloc call: ... line, go to the Tools and open the
ESP Exception Decoder.
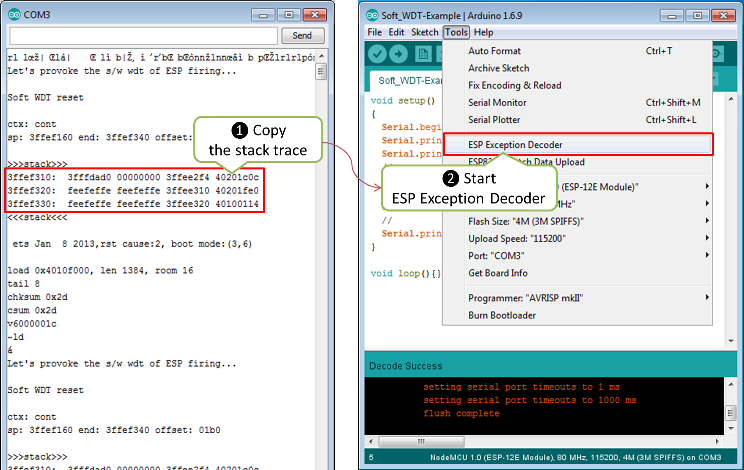
Decode the stack trace, steps 1 and 2
Now paste the stack trace to Exception Decoder’s window. At the bottom
of this window you should see a list of decoded lines of sketch you have
just uploaded to your ESP. On the top of the list, like on the top of
the stack trace, there is a reference to the last line executed just
before the software watchdog timer fired causing the ESP’s restart.
Check the number of this line and look it up on the sketch. It should be
the line Serial.println("Let's provoke the s/w wdt firing..."), that
happens to be just before while(true) that made the watchdog fired
(ignore the lines with comments, that are discarded by compiler).
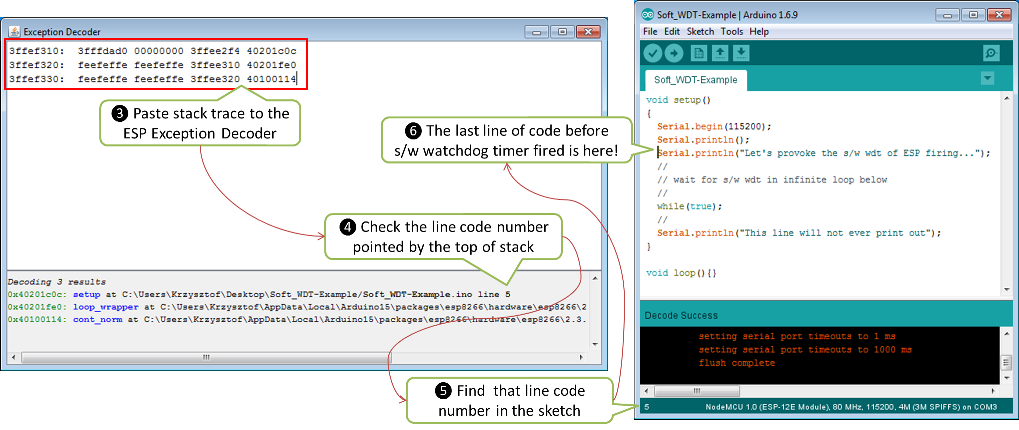
Decode the stack trace, steps 3 through 6
Armed with Arduino ESP8266/ESP32 Exception Stack Trace Decoder you can track down where the module is crashing whenever you see the stack trace dropped. The same procedure applies to crashes caused by exceptions.
Note: To decode the exact line of code where the application crashed, you need to use ESP Exception Decoder in context of sketch you have just loaded to the module for diagnosis. Decoder is not able to correctly decode the stack trace dropped by some other application not compiled and loaded from your Arduino IDE.
Other Causes for Crashes
- Interrupt Service Routines
By default, all functions are compiled into flash, which means that the cache may kick in for that code. However, the cache currently can’t be used during hardware interrupts. That means that, if you use a hardware ISR, such as attachInterrupt(gpio, myISR, CHANGE) for a GPIO change, the ISR must have the ICACHE_RAM_ATTR attribute declared. Not only that, but the entire function tree called from the ISR must also have the ICACHE_RAM_ATTR declared. Be aware that every function that has this attribute reduces available memory.
In addition, it is not possible to execute delay() or yield() from an ISR, or do blocking operations, or operations that disable the interrupts, e.g.: read a DHT.
Finally, an ISR has very high restrictions on timing for the executed code, meaning that executed code should not take longer than a very few microseconds. It is considered best practice to set a flag within the ISR, and then from within the loop() check and clear that flag, and execute code.
- Asynchronous Callbacks
- Asynchronous CBs, such as for the Ticker or ESPAsync* libs, have looser restrictions than ISRs, but some restrictions still apply. It is not possible to execute delay() or yield() from an asynchronous callback. Timing is not as tight as an ISR, but it should remain below a few milliseconds. This is a guideline. The hard timing requirements depend on the WiFi configuration and amount of traffic. In general, the CPU must not be hogged by the user code, as the longer it is away from servicing the WiFi stack, the more likely that memory corruption can happen.
- Memory, memory, memory
Running out of heap is the most common cause for crashes. Because the build process for the ESP leaves out exceptions (they use memory), memory allocations that fail will do so silently. A typical example is when setting or concatenating a large String. If allocation has failed internally, then the internal string copy can corrupt data, and the ESP will crash.
In addition, doing many String concatenations in sequence, e.g.: using operator+() multiple times, will cause memory fragmentation. When that happens, allocations may silently fail even though there is enough total heap available. The reason for the failure is that an allocation requires finding a single free memory block that is large enough for the size being requested. A sequence of String concatenations causes many allocations/deallocations/reallocations, which makes “holes” in the memory map. After many such operations, it can happen that all available holes are too small to comply with the requested size, even though the sum of all holes is greater than the requested size.
So why do these silent failures exist? On the one hand, there are specific interfaces that must be adhered to. For example, the String object methods don’t allow for error handling at the user application level (i.e.: no old-school error returns). On the other hand, some libraries don’t have the allocation code accessible for modification. For example, std::vector is available for use. The standard implementations rely on exceptions for error handling, which is not available for the ESP, and in any case there is no access to the underlying code.
Instrumenting the code with the OOM debug option and calls to
ESP.getFreeHeap()/ESP.getHeapFragmentation()/ESP.getMaxFreeBlockSize()will help the process of finding memory issues.Now is time to re-read about the exception decoder.
Some techniques for reducing memory usage
- Don’t use const char * with literals. Instead, use const char[] PROGMEM. This is particularly true if you intend to, e.g.: embed html strings.
- Don’t use global static arrays, such as uint8_t buffer[1024]. Instead, allocate dynamically. This forces you to think about the size of the array, and its scope (lifetime), so that it gets released when it’s no longer needed. If you are not certain about dynamic allocation, use std libs (e.g.: std:vector, std::string), or smart pointers. They are slightly less memory efficient than dynamically allocating yourself, but the provided memory safety is well worth it.
- If you use std libs like std::vector, make sure to call its ::reserve() method before filling it. This allows allocating only once, which reduces mem fragmentation, and makes sure that there are no empty unused slots left over in the container at the end.
- Stack
- The amount of stack in the ESP is tiny at only 4KB. For normal developement in large systems, it is good practice to use and abuse the stack, because it is faster for allocation/deallocation, the scope of the object is well defined, and deallocation automatically happens in reverse order as allocation, which means no mem fragmentation. However, with the tiny amount of stack available in the ESP, that practice is not really viable, at least not for big objects. * Large objects that have internally managed memory, such as String, std::string, std::vector, etc, are ok on the stack, because they internally allocate their buffers on the heap. * Large arrays on the stack, such as uint8_t buffer[2048] should be avoided on the stack and be dynamically allocated (consider smart pointers). * Objects that have large data members, such as large arrays, should be avoided on the stack, and be dynamicaly allocated (consider smart pointers).
If at the Wall, Enter an Issue Report
Using the procedure above you should be able to troubleshoot all the code you write. It may happen that ESP is crashing inside some library or code you are not familiar enough to troubleshoot. If this is the case then contact the application author by writing an issue report.
Follow the guidelines on issue reporting that may be provided by the author of code in his / her repository.
If there are no guidelines, include in your report the following:
- [ ] Exact steps by step instructions to reproduce the issue
- [ ] Your exact hardware configuration including the schematic
- [ ] If the issue concerns standard, commercially available ESP board with power supply and USB interface, without extra h/w attached, then provide just the board type or link to description
- [ ] Configuration settings in Arduino IDE used to upload the application
- [ ] Error log & messages produced by the application (enable debugging for more details)
- [ ] Decoded stack trace
- [ ] Copy of your sketch
- [ ] Copy of all the libraries used by the sketch
- [ ] If you are using standard libraries available in Library Manager, then provide just version numbers
- [ ] Version of esp8266 / Arduino core
- [ ] Name and version of your programming IDE and O/S
With plenty of ESP module types available, several versions of libraries or esp8266 / Arduino core, types and versions of O/S, you need to provide exact information what your application is about. Only then people willing to look into your issue may be able to refer it to configuration they have. If you are lucky, they may even attempt to reproduce your issue on their equipment. This will be far more difficult if you are providing only vague details, so somebody would need to ask you to find out what is really happening.
On the other hand if you flood your issue report with hundreds lines of code, you may also have difficulty to find somebody willing to analyze it. Therefore reduce your code to the bare minimum that is still causing the issue. It will help you as well to isolate the issue and pin done the root cause.
Conclusion
Do not be afraid to troubleshoot ESP exception and watchdog restarts. Esp8266 / Arduino core provides detailed diagnostics that will help you pin down the issue. Before checking the s/w, get your h/w right. Use ESP Exception Decoder to find out where the code fails. If you do you homework and still unable to identify the root cause, enter the issue report. Provide enough details. Be specific and isolate the issue. Then ask community for support. There are plenty of people that like to work with ESP and willing to help with your problem.